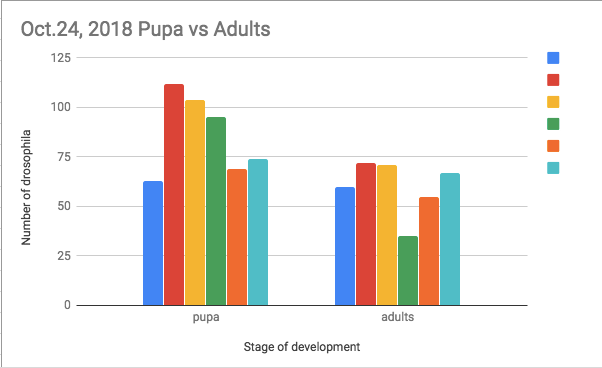
As Raegan and I continue to monitor the progress of our population cross, it is surprising to note that our flies continue to grow at an exponential rate. Using the same key as our last graph(s), it is evident that each tube has experienced significant growth, yet the relative rank regarding populations among tubes has stayed the same. However, whereas on October 17th tubes A, B, and C combined for 239 pupa and flies compared to D, E, and F’s 219, A, B, and C combine for 482 with D,E, and F combining for only 395. Thus, on October 17th the first three tubes represent 109.1% of the second three; this proportion has changed as the first three tubes now represent 122.0% of the second three. Strangely enough, this means that there have probably been not only more flies and pupa in the first three tubes throughout the experiment, but also that the total populations of the first three are increasing at a greater rate despite the fact that there is only one female in tubes A, B, and C in comparison to the three in D, E, and F. Concurring this is the fact that tube A has increased in total population by 339.3%, B by 62.8%, C by 78.6%, D by 46.0%, E by 195.2%, and F by 60.2%. Possible sources of error include the fact that multiple flies escaped during the practice of counting; our food has softened and has buried some flies, pupae, and larvae; and that we are still subtracting two from our population counts to account for parents despite the fact that some tubes had 4 parents and that the parents could have died in multiple tubes.
